-
PROVIDERS
Register now
Are you getting the full picture? A webinar series on the power of comprehensive intelligent diagnostics
-
LIFE SCIENCES
Enroll now
Tempus’ Patient-Derived Organoid ScreensEvaluate the efficacy of your preclinical compounds using fixed organoid panels designed for diverse therapeutic applications. Space is limited — enroll by June 30, 2025, to secure your spot.
-
PATIENTS
It's About Time
View the Tempus vision.
- RESOURCES
-
ABOUT US
View Job Postings
We’re looking for people who can change the world.
- INVESTORS
08/06/2024
Tempus Reports Second Quarter 2024 Results
CHICAGO, August 6, 2024 — Tempus AI, Inc. (NASDAQ: TEM), a technology company leading the adoption of AI to advance precision medicine and patient care, today reported financial results for the quarter that ended June 30, 2024, and provided recent business highlights.
- Revenue increased 25% year-over-year to $166.0 million in the second quarter of 2024
- Data licensing revenue growth accelerated to 40% year-over-year
- Expanded into the minimal residual disease (MRD) market with the launch of both tumor-naïve and tumor-informed assays
- Established a joint venture with Softbank to enter the Japanese market
- Raised $410.7 million of gross proceeds in initial public offering
- Net Loss of ($552.2 million), largely driven by $493.1 million of stock compensation expense and related employer payroll taxes tied to initial public offering
- Adjusted EBITDA improved $12.7 million quarter-over-quarter to ($31.2 million)
- Expect full year 2024 revenue of ~$700 million, which represents ~32% annual growth
- For additional information on the quarter, including a letter from our CEO, please visit our investor relations site
“We continue to make great progress in deploying technology within healthcare as providers and life science companies are increasingly seeking AI solutions,” said Eric Lefkofsky, Founder and CEO of Tempus. “Given our expansive multimodal dataset, and our broad reach across thousands of connected healthcare providers, we are uniquely positioned to advance AI in diagnostics and accelerate the pace of algorithmic insights.”
Second Quarter 2024 Financial Results
| Three months ended June 30, | |||
|---|---|---|---|
| 2024 | 2023 | Change | |
| (in thousands, except percentages) | |||
| GAAP Results | |||
| Revenue | $165,969 | $132,417 | 25.3% |
| Genomics gross margin | 39.2% | 48.9% | NM(1) |
| Data and services gross margin | 58.7% | 65.9% | NM(1) |
| Operating expenses | $609,005 | $116,787 | NM(1) |
| Net loss | $(552,212) | $(55,832) | NM(1) |
| Non-GAAP Results | |||
| Non-GAAP Genomics gross margin | 49.4% | 48.9% | 50 bps |
| Non-GAAP Data and services gross margin | 72.4% | 65.9% | 650 bps |
| Non-GAAP Operating Expenses | $134,742 | $116,787 | 15.4% |
| Adjusted EBITDA | $(31,186) | $(36,967) | 15.6% |
1. Not meaningful due to the impact of including stock compensation expense and related employer payroll taxes
- Genomics revenue of $112.3 million in the second quarter of 2024, an increase of $20.4 million or 22.2% over the second quarter of 2023.
- Data and services revenue of $53.6 million in the second quarter of 2024, an increase of $13.2 million or 32.5% over the second quarter of 2023, including 40% growth in our Insights (data licensing) business.
- Non-GAAP Genomics gross margin was 49.4% in the second quarter of 2024, compared to 48.9% in the second quarter of 2023.
- Non-GAAP Data and services gross margin was 72.4% in the second quarter of 2024, compared to 65.9% in the second quarter of 2023.
- Net Loss of ($552.2 million), largely driven by $493.1 million of stock compensation and related employer payroll taxes tied to initial public offering.
- Adjusted EBITDA ($31.2 million) in the second quarter of 2024, compared to ($43.9 million) in the first quarter of 2024.
Recent Operating Highlights
- Announced the clinical launch of our MRD portfolio including Tempus’ xM tumor-naïve test and xM tumor-informed (NeXT Personal® Dx) test.
- Received 510(k) clearance from the U.S. Food and Drug Administration (FDA) for the Tempus ECG-AF device that uses AI to help identify patients who may be at increased risk of atrial fibrillation/flutter (AF).
- Completed a Joint Venture Agreement with SoftBank, titled “SB Tempus,” to bring Tempus’ AI-enabled precision medicine solutions to Japan.
- Received Advanced Diagnostic Laboratory Test (ADLT) status from the Centers for Medicare & Medicaid Services (CMS) for Tempus’ next-generation sequencing assay, xT CDx.
- Sold 11,100,000 shares of Class A common stock at $37 per share in initial public offering, raising $410.7 million of gross proceeds.
Financial Outlook and Guidance
Tempus expects full year 2024 revenue of approximately $700 million, which represents approximately 32% year-over-year growth. The Company expects approximately ($105 million) in adjusted EBITDA, an improvement of approximately $50 million over 2023.
Webcast and Conference Call Information
A conference call and webcast will begin today, August 6, 2024 after market close at 4:30 p.m. Eastern Time. Interested parties may access details at:
- Conference ID: 6326328
- Domestic Dial-in Number: (800) 715-9871
- International Dial-in Number: (646) 307-1963
- Live Webcast: https://edge.media-server.com/mmc/p/75k462fh
The webcast may be accessed on the company’s investor relations website at investors.tempus.com. For those unable to listen to the live webcast, a recording will be made available on the company’s website after the event and will be accessible for one year. Visit the investor relations website to find the company’s latest deck, and commentary on the quarter by Eric Lefkofsky, Founder and CEO and Jim Rogers, CFO, which will be discussed on the conference call and webcast.
About Tempus
Tempus is a technology company advancing precision medicine through the practical application of artificial intelligence in healthcare. With one of the world’s largest libraries of multimodal data, and an operating system to make that data accessible and useful, Tempus provides AI-enabled precision medicine solutions to physicians to deliver personalized patient care and in parallel facilitates discovery, development and delivery of optimal therapeutics. The goal is for each patient to benefit from the treatment of others who came before by providing physicians with tools that learn as the company gathers more data. For more information, visit tempus.com.
Non-GAAP Financial Measures
In addition to the financial information presented in this release in accordance with accounting principles generally accepted in the United States of America (GAAP), Tempus also presents adjusted non-GAAP financial measures.
Non-GAAP gross profit is defined as GAAP gross profit, excluding stock-based compensation expense and employer payroll tax related to stock-based compensation (collectively, the “stock-based compensation adjustments”). Non-GAAP gross margin is defined as gross profit, excluding the stock-based compensation adjustments, as a percentage of revenue. Non-GAAP operating expenses are calculated as the sum of technology research and development expense, research and development expense, and selling, general and administrative expense, excluding the stock-based compensation adjustments. Non-GAAP net income (loss) is defined as net income (loss), adjusted to exclude (i) losses on equity method investments, (ii) changes in fair value of our warrant liability, warrant asset, marketable equity securities, contingent consideration liabilities and indemnity-related holdback liabilities, and (iv) the payment of $2.3 million of our Series G-4 convertible preferred stock in connection with the initial public offering (the “G-4 Special Payment”). Non-GAAP net income (loss) per share is defined as adjusted net income (loss) divided by weighted average common shares outstanding, basic and diluted.
Adjusted EBITDA is defined as net income (loss), adjusted to exclude (i) interest income, (ii) interest expense, (iii) depreciation and amortization, (iv) provision for (benefit from) income taxes, (v) losses on equity method investments, (vi) changes in fair value of our warrant liability, warrant asset, marketable equity securities, contingent consideration liabilities and indemnity-related holdback liabilities, (vii) the stock-based compensation adjustments, and (Viii) the G-4 Special Payment. Adjusted EBITDA margin is calculated as adjusted EBITDA as a percentage of revenue.
Tempus believes these non-GAAP financial measures are useful to investors and others because they allow for additional information with respect to financial measures used by management in its financial and operational decision-making and they may be used by institutional investors and the analyst community to help them analyze the health of Tempus’ business. In particular, Adjusted EBITDA is a key measurement used by Tempus management to make operating decisions, including those related to analyzing operating expenses, evaluating performance, and performing strategic planning and annual budgeting. However, there are a number of limitations related to the use of non-GAAP financial measures, and these non-GAAP measures should be considered in addition to, not as a substitute for or in isolation from, our financial results prepared in accordance with GAAP. Other companies, including companies in our industry, may calculate these non-GAAP financial measures differently or not at all, which reduces their usefulness as comparative measures.
Tempus does not provide guidance for net loss, the most directly comparable GAAP measure to Adjusted EBITDA, and similarly cannot provide a reconciliation between its forecasted Adjusted EBITDA and net loss without unreasonable effort due to the unavailability of reliable estimates for certain components of net income and the respective reconciliations. These forecasted items are not within Tempus’ control, may vary greatly between periods and could significantly impact future financial results.
Forward Looking Statements
This press release contains forward-looking statements within the meaning of Section 27A of the Securities Act of 1933, as amended (the “Securities Act”), and Section 21E of the Securities Exchange Act of 1934, as amended, about Tempus and Tempus’ industry that involve substantial risks and uncertainties. All statements other than statements of historical facts contained in this press release are forward-looking statements, including, but not limited to, Tempus’ expected financial results for full year 2024; the contributions of Tempus’ research and findings to the larger scientific community and the use of Tempus’ products and services to advance clinical care for patients. In some cases, you can identify forward-looking statements because they contain words such as “anticipate,” “believe,” “contemplate,” “continue,” “could,” “estimate,” “expect,” “going to,” “intend,” “may,” “plan,” “potential,” “predict,” “project,” “should,” “target,” “will,” or “would” or the negative of these words or other similar terms or expressions. Tempus cautions you that the foregoing may not include all of the forward-looking statements made in this press release.
You should not rely on forward-looking statements as predictions of future events. Tempus has based the forward-looking statements contained in this press release primarily on its current expectations and projections about future events and trends that it believes may affect Tempus’ business, financial condition, results of operations and prospects. These forward-looking statements are subject to risks and uncertainties related to: the intended use of Tempus’ products and services; Tempus’ financial performance; the ability to attract and retain customers and partners; managing Tempus’ growth and future expenses; competition and new market entrants; compliance with new laws, regulations and executive actions, including any evolving regulations in the artificial intelligence space; the ability to maintain, protect and enhance Tempus’ intellectual property; the ability to attract and retain qualified team members and key personnel; the ability to repay or refinance outstanding debt, or to access additional financing; future acquisitions, divestitures or investments; the potential adverse impact of climate change, natural disasters, health epidemics, macroeconomic conditions, and war or other armed conflict, as well as risks, uncertainties, and other factors described in the section titled “Risk Factors” in Tempus’ Final Prospectus filed with the Securities and Exchange Commission (“SEC”) on June 17, 2024, pursuant to Rule 424(b)(4) under the Securities Act, as well as in other filings Tempus may make with the SEC in the future, including its Quarterly Report on Form 10-Q for the quarter ended June 30, 2024. In addition, any forward-looking statements contained in this press release are based on assumptions that Tempus believes to be reasonable as of this date. Tempus undertakes no obligation to update any forward-looking statements to reflect events or circumstances after the date of this press release or to reflect new information or the occurrence of unanticipated events, except as required by law.
Contacts
Tempus Communications
Erin Carron
media@tempus.com
Tempus Investor Relations
Elizabeth Krutoholow
elizabeth.krutoholow@tempus.com
H/Advisors Abernathy
Dan Scorpio
dan.scorpio@h-advisors.global
Source: Tempus AI, Inc.
Tempus AI, Inc.
Condensed Consolidated Statements of Operations and Comprehensive Loss
(unaudited)
(in thousands, except per share amounts)
| Three Months Ended June 30, | Six Months Ended June 30, | |||||||
|---|---|---|---|---|---|---|---|---|
| 2024 | 2023 | 2024 | 2023 | |||||
| Net revenue | ||||||||
| Genomics | $ | 112,324 | $ | 91,924 | $ | 214,893 | $ | 173,982 |
| Data and services | 53,645 | 40,493 | 96,896 | 74,059 | ||||
| Total net revenue | $ | 165,969 | $ | 132,417 | $ | 311,789 | $ | 248,041 |
| Cost and operating expenses | ||||||||
| Cost of revenues, genomics | 68,324 | 46,961 | 121,159 | 92,241 | ||||
| Cost of revenues, data and services | 22,132 | 13,807 | 37,420 | 25,200 | ||||
| Technology research and development | 77,908 | 23,427 | 104,975 | 46,329 | ||||
| Research and development | 68,025 | 22,171 | 92,365 | 43,034 | ||||
| Selling, general and administrative | 463,072 | 71,189 | 542,636 | 140,236 | ||||
| Total cost and operating expenses | 699,461 | 177,555 | 898,555 | 347,040 | ||||
| Loss from operations | $ | (533,492) | $ | (45,138) | $ | (586,766) | $ | (98,999) |
| Interest income | 1,718 | 1,957 | 2,749 | 4,381 | ||||
| Interest expense | (13,295) | (11,712) | (26,533) | (20,903) | ||||
| Other (expense) income, net | (7,048) | (766) | (6,299) | 5,622 | ||||
| Loss before provision for income taxes | $ | (552,117) | $ | (55,659) | $ | (616,849) | $ | (109,899) |
| Provision for income taxes | (95) | (3) | (106) | (9) | ||||
| Losses from equity method investments | – | (170) | – | (301) | ||||
| Net loss | $ | (552,212) | $ | (55,832) | $ | (616,955) | $ | (110,209) |
| Dividends on Series A, B, B-1, B-2, C, D, E, F, G, G-3, and G-4 preferred shares | (11,540) | (10,897) | (39,347) | (21,566) | ||||
| Cumulative Undeclared Dividends on Series C preferred shares | (668) | (745) | (1,174) | (1,466) | ||||
| Net loss attributable to common shareholders, basic and diluted | (564,420) | (67,474) | (657,476) | (133,241) | ||||
| Net loss per share attributable to common shareholders, basic and diluted | $ | (6.86) | $ | (1.07) | $ | (9.02) | $ | (2.11) |
| Weighted-average shares outstanding used to compute net loss per share, basic and diluted | 82,325 | 63,286 | 72,930 | 63,257 | ||||
| Comprehensive Loss, net of tax | ||||||||
| Net loss | $ | 552,212 | $ | 55,832 | $ | 616,955 | $ | 110,209 |
| Foreign currency translation adjustment | (43) | 53 | (99) | 25 | ||||
| Comprehensive loss | $ | (552,255) | $ | (55,779) | $ | (617,054) | $ | (110,184) |
Tempus AI, Inc.
Condensed Consolidated Balance Sheets
(unaudited)
(in thousands, except share and per share amounts)
| June 30, 2024 | December 31, 2023 | |||
|---|---|---|---|---|
| Assets | ||||
| Current Assets | $ | 478,811 | $ | 165,767 |
| Cash and cash equivalents | ||||
| Accounts receivable, net of allowances of $1,092 and $1,115 at June 30, 2024 and December 31, 2023, respectively | 118, 106 | 94,462 | ||
| Inventory | 32,690 | 28,845 | ||
| Warrant asset | 800 | 5,070 | ||
| Prepaid expenses and other current assets | 29,704 | 17,295 | ||
| Marketable equity securities | 11,255 | 31,807 | ||
| Deferred offering costs | – | 7,085 | ||
| Total current assets | $ | 671,366 | $ | 350,331 |
| Property and equipment, net | 60,539 | 61,681 | ||
| Goodwill | 73,345 | 73,354 | ||
| Warrant asset, less current portion | 1,500 | 4,930 | ||
| Intangible assets, net | 16,252 | 21,916 | ||
| Investments and other assets | 7,677 | 8,971 | ||
| Warrant contract asset, less current portion | 19,077 | 21,499 | ||
| Operating lease right-of-use assets | 13,994 | 20,530 | ||
| Restricted cash | 861 | 840 | ||
| Total Assets | $ | 864,611 | $ | 564,052 |
| Liabilities, Convertible redeemable preferred stock, and Stockholders’ equity (deficit) | ||||
| Current liabilities | 28,646 | 54,421 | ||
| Account payable | 85,185 | 82,517 | ||
| Accrued expenses | 50,905 | 64,860 | ||
| Deferred revenue | 7,273 | 8,213 | ||
| Other current liabilities | 5,828 | $ | 6,437 | |
| Accrued data licensing fees | 3,727 | 6,382 | ||
| Accrued dividends | – | 9,797 | ||
| Total current liabilities | $ | 181,564 | $ | 232,627 |
| Operating lease liabilities, less current portion | 27,238 | 32,040 | ||
| Convertible promissory note | 180,648 | 193,124 | ||
| Warrant liability | 33,600 | 34,500 | ||
| Other long-term liabilities | 16,790 | 19,751 | ||
| Interest payable | 62,608 | 55,321 | ||
| Long-term debt, net | 261,853 | 256,541 | ||
| Deferred revenue, less current portion | 2,059 | 16,768 | ||
| Total Liabilities | $ | 766,360 | $ | 840,672 |
| Commitments and contingencies (Note 7) | ||||
| Convertible redeemable preferred stock, $0.0001 par value, no and 69,803,765 shares authorized at June 30, 2024 and December 31, 2023, respectively; no and 63,525,953 shares issued and outstanding at June 30, 2024 and December 31, 2023, respectively; aggregate liquidation preference of $0 and $1,130,429 at June 30, 2024 and December 31, 2023, respectively | $ | – | $ | 1,105,543 |
| Stockholders’ equity (deficit) | ||||
| Class A Voting Common Stock, $0.0001 par value, 1,000,000,000 and 200,228,024 shares authorized at June 30, 2024 and December 31, 2023, respectively; 149,274,923 and 58,367,961 shares issued and outstanding at June 30, 2024 and December 31, 2023, respectively | $ | 15 | $ | 6 |
| Class B Voting Common Stock, $0.0001 par value, 5,500,000 and 5,374,899 shares authorized at June 30, 2024 and December 31, 2023, respectively; 5,043,789 and no shares issued and outstanding at June 30, 2024 and December 31, 2023, respectively | 1 | – | ||
| Non-voting Common Stock, $0.0001 par value, no and 66,946,627 shares authorized at June 30, 2024 and December 31, 2023, respectively; no shares issued and outstanding at June 30, 2024, and 5,205,802 shares issued and 5,060,336 shares outstanding at December 31, 2023 | – | 0 | ||
| Treasury Stock, 145,466 shares at June 30, 2024 and December 31, 2023, at cost | (3,602) | (3,602) | ||
| Additional Paid-In Capital | 2,163,911 | 18,345 | ||
| Accumulated Other Comprehensive (Loss) Income | (94) | 5 | ||
| Accumulated deficit | (2,061,980) | (1,396,917) | ||
| Total Stockholders’ equity (deficit) | $ | 98,251 | $ | (1,382,163) |
| Total Liabilities, Convertible redeemable preferred stock, and Stockholders’ equity (deficit) | $ | 864,611 | $ | 564,052 |
Tempus AI, Inc.
Condensed Consolidated Statements of Cash Flows
(unaudited)
(in thousands, except per share amounts)
| Six Months Ended June 30, | ||||
|---|---|---|---|---|
| 2024 | 2023 | |||
| Operating activities | ||||
| Net loss | $ | (616,955) | $ | (110,209) |
| Adjustments to reconcile net loss to net cash used in operating activities | ||||
| Change in fair value of warrant liability | $ | (900) | $ | (5,700) |
| Stock-based compensation | 488,313 | – | ||
| Gain on warrant exercise | (173) | – | ||
| Gain on marketable equity securities | (2,541) | – | ||
| Amortization of original issue discount | 691 | 489 | ||
| Amortization of deferred financing fees | 255 | 255 | ||
| Change in fair value of contingent consideration | 165 | – | ||
| Amortization of warrant contract asset | 2,422 | 3,307 | ||
| Depreciation and amortization | 18,348 | 16,185 | ||
| Provision for bad debt expense | 327 | 1,376 | ||
| Change in fair value of warrant asset | 7,700 | – | ||
| Loss from equity-method investments | – | 301 | ||
| Amortization of finance right-of-use lease assets | – | 190 | ||
| Non-cash operating lease costs | 3,252 | 3,382 | ||
| Minimum accretion expense | 92 | 187 | ||
| Impairment of intangible assets | – | 7,359 | ||
| PIK interest added to principal | 4,366 | 297 | ||
| Change in assets and liabilities | ||||
| Accounts receivable | (23,971) | (6,850) | ||
| Inventory | (3,845) | (5,101) | ||
| Prepaid expenses and other current assets | (12,409) | (1,634) | ||
| Investments and other assets | 1,294 | (4,528) | ||
| Accounts payable | (33,371) | (4,195) | ||
| Deferred revenue | (28,669) | (19,974) | ||
| Accrued data licensing fees | (2,749) | (7,608) | ||
| Accrued expenses & other | (2,805) | 8,125 | ||
| Interest payable | 7,287 | 7,611 | ||
| Operating net liabilities | (4,582) | (4,352) | ||
| Net cash used in operating activities | $ | (198,458) | $ | (121,087) |
| Investing activities | ||||
| Purchases of property and equipment | $ | (14,116) | $ | (15,906) |
| Proceeds from sales of marketable equity securities | 23,098 | – | ||
| Business combinations, net of cash acquired (Note 4) | – | (2,869) | ||
| Net cash provided by (used in) investing activities | $ | 8,982 | $ |
(18,775) |
| Financing activities | ||||
| Proceeds from issuance of common stock in connection with initial public offering, net of underwriting discounts and commissions | $ | 381,951 | $ | – |
| Tax withholding related to net share settlement of restricted stock units | (69,918) | – | ||
| Issuance of Series G-5 Preferred Stock | 199,750 | – | ||
| Principal payments on finance lease liabilities | – | (192) | ||
| Purchase of treasury stock | – | (3,602) | ||
| Payment of deferred offering costs | (2,714) | (151) | ||
| Dividends paid | (5,625) | (5,625) | ||
| Proceeds from long-term debt, net of original issue discount | – | 48,750 | ||
| Payment of indemnity holdback related to acquisition | (813) | – | ||
| Net cash provided by financing activities | $ | 502,631 | $ | 39,180 |
| Effect of foreign exchange rates on cash | $ | (90) | $ | 28 |
| Net increase (decrease) in Cash, Cash Equivalents and Restricted Cash | $ | 313,065 | $ | (100,654) |
| Cash, cash equivalents and restricted cash, beginning of period | 166,607 | 303,731 | ||
| Cash, cash equivalents and restricted cash, end of period | $ | 479,672 | $ | 203,077 |
| Cash, Cash Equivalents and Restricted Cash are Comprised of: | ||||
| Cash and cash equivalents | $ | 478,811 | $ | 202,266 |
| Restricted cash and cash equivalents | 861 | 811 | ||
| Total cash, cash equivalents and restricted cash | $ | 479,672 | $ | 203,077 |
| Supplemental disclosure of cash flow information | ||||
| Cash paid during the year for interest | $ | 13,921 | $ | 5,691 |
| Cash paid for income taxes | $ | 89 | $ | 41 |
| Supplemental disclosure of noncash investing and financing activities | ||||
| Dividends payable | $ | 5,487 | $ | 4,545 |
| Purchases of property and equipment, accrued but not paid | $ | 1,108 | $ | 2,952 |
| Deferred offering costs, accrued but not yet paid | $ | 6,051 | $ | 2,917 |
| Redemption of convertible promissory note | $ | 12,476 | $ | 13,926 |
| Non-voting common stock issued in connection with business combinations | $ |
344 | $ | 4,305 |
| Operating lease liabilities arising from obtaining right-of-use assets | $ | – | $ | 892 |
| Conversion of redeemable convertible preferred stock to common stock in connection with initial public offering | $ | 1,348,809 | $ | – |
| Taxes related to net share settlement of restricted stock units not yet paid | $ | 164 | $ | – |
| Reclassification of deferred offering costs to additional paid-in capital upon initial public offering | $ | 12,347 | $ | – |
| Issuance of Series G-3 Preferred Stock | $ | 3,809 | $ | 2,738 |
| Issuance of Series G-4 Preferred Stock | $ | 611 | $ | – |
Tempus AI, Inc.
Reconciliation of GAAP to Non-GAAP Financial Measures
(unaudited)
(in thousands, except percentages and per share amounts)
Genomics Gross Profit & Gross Margin
| Three Months Ended June 30, | Six Months Ended June 30, | |||||||
|---|---|---|---|---|---|---|---|---|
| 2024 | 2023 | 2024 | 2023 | |||||
| Genomics revenue | $ | 112,324 | $ | 91,924 | $ | 214,893 | $ | 173,982 |
| Cost of revenues, genomics | 68,324 | 46,961 | 121,159 | 92,241 | ||||
| Gross profit, genomics | $ | 44,000 | $ | 44,963 | $ | 93,734 | $ | 81,741 |
| Stock-based compensation expense | 11,327 | – | 11,327 | – | ||||
| Employer payroll tax related to stock-based compensation | 136 | – | 136 | – | ||||
| Non-GAAP gross profit, genomics | $ | 55,463 | $ | 44,963 | $ | 105,197 | $ | 81,741 |
| Genomics gross margin | 39.2% | 48.9% | 43.6% | 47.0% | ||||
| Stock-based compensation expense | 10.1% | 0.0% | 5.3% | 0.0% | ||||
| Employer payroll tax related to stock-based compensation | 0.1% | 0.0% | 0.1% | 0.0% | ||||
| Non-GAAP gross margin, genomics | 49.4% | 48.9% | 49.0% | 47.0% | ||||
Data and Services Gross Profit & Gross Margin
| Three Months Ended June 30, | Six Months Ended June 30, | |||||||
|---|---|---|---|---|---|---|---|---|
| 2024 | 2023 | 2024 | 2023 | |||||
| Data and services revenue | $ | 53,645 | $ | 40,493 | $ | 96,896 | $ | 74,059 |
| Costs of revenues, data and services | 22,132 | 13,807 | 37,420 | 25,200 | ||||
| Gross profit, data and services | $ | 31,513 | $ | 26,686 | $ | 59,476 | $ | 48,859 |
| Stock-based compensation expense | 7,229 | – | 7,229 | – | ||||
| Employer payroll tax related to stock-based compensation | 119 | – | 119 | |||||
| Non-GAAP gross profit, data and services | $ | 38,861 | $ | 26,686 | $ | 66,824 | $ | 48,859 |
| Gross margin, data and services | 58.7% | 65.9% | 61.4% | 66.0% | ||||
| Stock-based compensation expense | 13.5% | 0.0% | 7.5% | 0.0% | ||||
| Employer payroll tax related to stock-based compensation | 0.2% | 0.0% | 0.1 | 0.0% | ||||
| Non-GAAP gross margin, data and services | 72.4% | 65.9% | 69.0% | 66.0% | ||||
Total Gross Profit & Gross Margin
| Three Months Ended June 30, | Six Months Ended June 30, | |||||||
|---|---|---|---|---|---|---|---|---|
| 2024 | 2023 | 2024 | 2023 | |||||
| Net revenue | $ | 165,969 | $ | 132,417 | $ | 311,789 | $ | 248,041 |
| Costs of revenues | 90,456 | 60,768 | 158,579 | 117,441 | ||||
| Gross profit | $ | 75,513 | $ | 71,649 | $ | 153,210 | $ | 130,600 |
| Stock-based compensation expense | 18,556 | – | 18,556 | – | ||||
| Employer payroll tax related to stock-based compensation | 255 | – | 255 | |||||
| Non-GAAP gross profit | $ | 94,324 | $ | 71,649 | $ | 172,021 | $ | 130,600 |
| Gross margin | 45.5% | 54.1% | 49.1% | 52.7% | ||||
| Stock-based compensation expense | 11.2% | 0.0% | 6.0% | 0.0% | ||||
| Employer payroll tax related to stock-based compensation | 0.0% | 0.0% | 0.1% | 0.0% | ||||
| Non-GAAP gross margin | 56.8% | 54.1% | 55.2% | 52.7% | ||||
Operating Expenses
| Three Months Ended June 30, | Six Months Ended June 30, | |||||||
|---|---|---|---|---|---|---|---|---|
| 2024 | 2023 | 2024 | 2023 | |||||
| Technology research and development | $ | 77,908 | $ | 23,427 | $ | 104,975 | $ | 46,329 |
| Stock-based compensation expense | 50,434 | – | 50,434 | – | ||||
| Employer payroll tax related to stock-based compensation | 1,248 | – | 1,248 | – | ||||
| Non-GAAP technology research and development | $ | 26,226 | $ | 23,427 | $ | 53,293 | $ | 46,329 |
| Research and development | $ | 68,025 | $ | 22,171 | $ | 92,365 | $ | 43,034 |
| Stock-based compensation expense | 42,233 | – | 42,233 | – | ||||
| Employer payroll tax related to stock-based compensation | 676 | – | 676 | – | ||||
| Non-GAAP research and development | $ | 25,116 | $ | 22,171 | $ | 49,456 | $ | 43,034 |
| Selling, general and administrative | $ | 463,072 | $ | 71,189 | $ | 542,636 | $ | 140,236 |
| Stock-based compensation expense | 377,090 | – | 377,090 | – | ||||
| Employer payroll tax related to stock-based compensation | 2,582 | – | 2,582 | – | ||||
| Non-GAAP selling, general and administrative | $ | 83,400 | $ | 71,189 | $ | 162,964 | $ | 140,236 |
| Operating expenses | $ | 609,005 | $ | 116,787 | $ | 739,976 | $ | 229,599 |
| Stock-based compensation expense | 469,757 | – | 469,757 | – | ||||
| Employer payroll tax related to stock-based compensation | 4,506 | – | 4,506 | – | ||||
| Non-GAAP operating expenses | $ | 134,742 | $ | 116,787 | $ | 265,713 | $ | 229,599 |
Earnings per Share
| Three Months Ended June 30, 2024 | Six Months Ended June 30, 2024 | |||
|---|---|---|---|---|
| Net loss | $ | (552,212) | $ | (616,955) |
| Fair market changes(1) | 4,870 | 4,280 | ||
| Stock-based compensation expense | 488,313 | 488,313 | ||
| Employer payroll tax related to stock-based compensation from IPO | 4,762 | $ | 4,762 | |
| G-4 Special Payment | 2,250 | 2,250 | ||
| Non-GAAP net loss | $ | (52,017) | $ | (117,350) |
| Non-GAAP net loss per share | $ | (0.63) | $ | (1.61) |
| Weighted average common shares outstanding, basic and diluted | 82,325 | 72,930 | ||
1. Fair value changes include gains and losses related to quarterly fair value adjustments of our warrant liability, warrant asset, marketable equity securities, contingent consideration liabilities, and indemnity-related holdback liabilities.
Adjusted EBITDA
| Three Months Ended June 30, | Six Months Ended June 30, | |||||||
|---|---|---|---|---|---|---|---|---|
| 2024 | 2023 | 2024 | 2023 | |||||
| Net loss | $ | (552,212) | $ | (55,832) | $ | (616,955) | $ | (110,209) |
| Interest income | (1,718) | (1,957) | (2,749) | (4,381) | ||||
| Interest expense | 13,295 | 11,712 | 26,533 | 20,903 | ||||
| Depreciation | 6,415 | 5,194 | 12,684 | 10,254 | ||||
| Amortization | 2,744 | 3,043 | 5,664 | 5,931 | ||||
| Provision for income taxes | 95 | 3 | 106 | 9 | ||||
| EBITDA | $ | (531,381) | $ | (37,837) | $ | (574,717) | $ | (77,493) |
| Loses on equity method investments | – | 170 | – | 301 | ||||
| Fair market changes(1) | 4,870 | 700 | 4,280 | (5,700) | ||||
| Stock-based compensation expense | 488,313 | – | 488,313 | – | ||||
| Employer payroll tax related to stock-based compensation | 4,762 | – | 4,762 | – | ||||
| G-4 Special Payment | 2,250 | – | 2,250 | – | ||||
| Adjusted EBITDA | $ | (31,186) | $ | (36,967) | $ | (75,112) | $ | (82,892) |
1. Fair value changes include gains and losses related to quarterly fair value adjustments of our warrant liability, warrant asset, marketable equity securities, contingent consideration liabilities, and indemnity-related holdback liabilities.
-
 04/02/2025
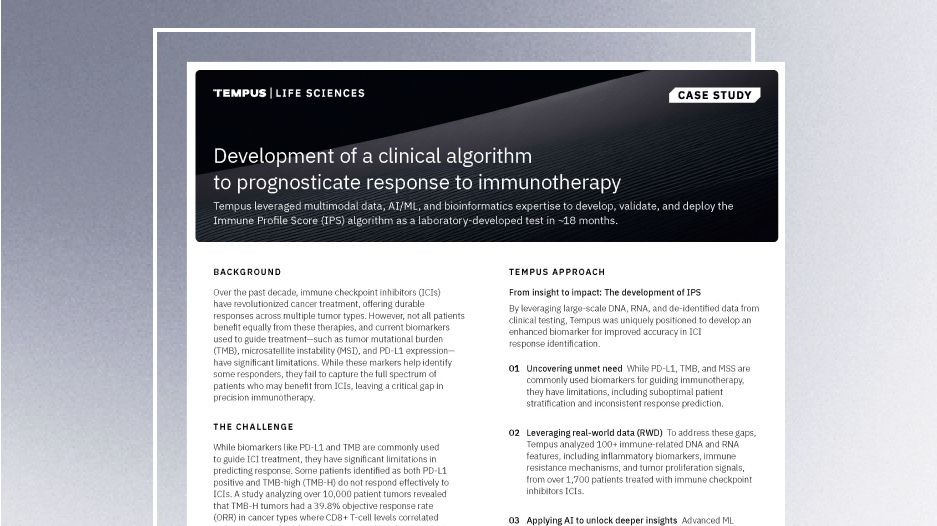
Development of a clinical algorithm to prognosticate response to immunotherapy
Discover how Tempus developed and deployed the Immune Profile Score (IPS)—a powerful algorithm that provides prognostic insights into patient outcomes following treatment with immune checkpoint inhibitors (ICIs)—in ~18 months. This case study highlights the AI-driven methodology, real-world validation, and the impact of IPS in precision oncology.
Read more -
 03/25/2025
AI & ML in action: Unlocking RWD with GenAI through Tempus Lens
Discover how Tempus is equipping researchers with innovative AI solutions to fully leverage the potential of multimodal data. Gain insights from a panel of leaders across healthcare and life sciences as they discuss the impact of these advanced tools on delivering insights with speed.
Watch replay
Secure your recording now. -
 03/11/2025
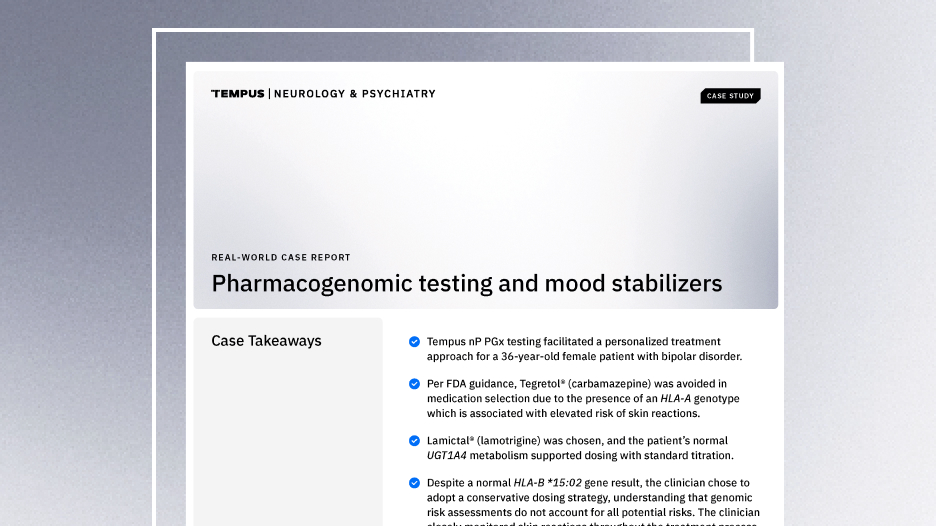
Case Report: Pharmacogenomic testing and mood stabilizers
This real-world case demonstrates how the Tempus nP pharmacogenomic test facilitated a personalized treatment approach for a patient with bipolar disorder.
Read more